Global Brand Performance Dashboard
One measurement system for 73 markets

A global company cannot compare brands when every country defines sales, distribution, currency, and reporting periods differently. This design creates one governed measurement system, then gives executives, brand teams, and country managers the views they need from the same underlying facts.
A dashboard spanning 73 markets needs to distinguish shipments to distributors from sales at the till. Currency conversion and reporting periods need agreed rules too. Otherwise, two countries can report the same metric name while measuring different activity. This design starts with those definitions, before choosing the charts.
Start by agreeing what “brand performance” means
The model separates three questions: how a brand is performing, what marketing may have contributed, and where distribution is missing. These require different measures. A market-share estimate, a consumer survey and a distributor shipment cannot be treated as interchangeable evidence of demand.
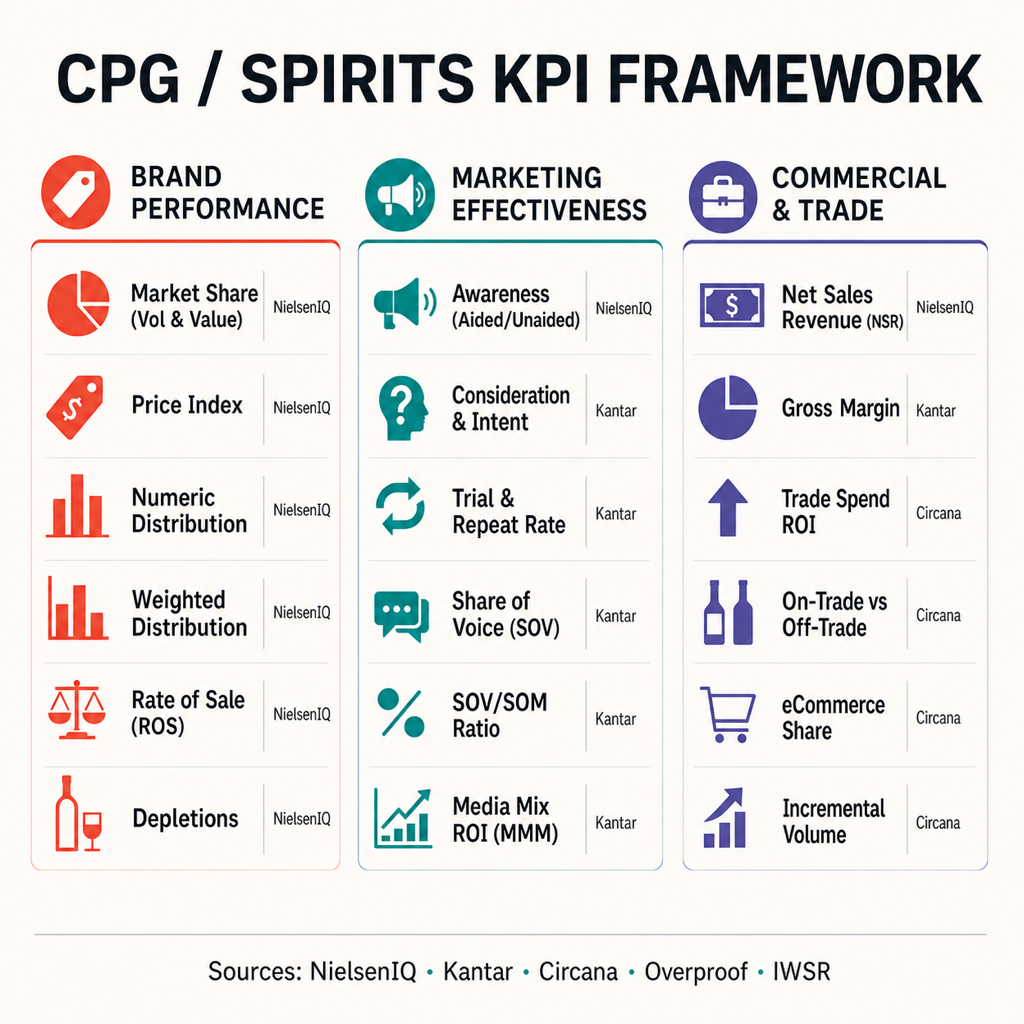
Is the brand gaining or losing ground?
Each comparison needs the same category, channel coverage and reporting period. The references and providers listed below are starting points for defining the measures, not evidence that their datasets were integrated into the prototype.
| Metric | Description | Source |
|---|---|---|
| Volume & Value Share | Brand's sales as % of total market | NielsenIQ, IWSR |
| Price Index | Brand's avg price relative to category average | Circana, SmashBrand |
| Numeric Distribution | % of stores in a market that carry the brand | NielsenIQ, Overproof |
| Weighted Distribution | % of total category sales from stores carrying the brand | Overproof |
| Rate of Sale (ROS) | Avg units sold per store per week, sales velocity | Overproof |
| Depletions | Volume leaving distributor warehouses for accounts, not sales to the final consumer | Overproof |
Did marketing change demand?
| Metric | Description | Source |
|---|---|---|
| Awareness (Aided/Unaided) | % of surveyed consumers who recognize or recall the brand | Kantar BrandZ |
| Consideration & Intent | % of aware consumers who would purchase | Kantar |
| Share of Voice (SOV) | Brand's share of total advertising impressions in category | SmashBrand, Nielsen |
| SOV/SOM Ratio | SOV / Share of Market. Above 1, advertising share exceeds market share; the ratio alone does not predict growth. | Nielsen |
| Media Mix Modeling (MMM) | Model-based estimates of channel contribution to sales, subject to data and causal assumptions | Google Meridian, Meta Robyn |
| Incremental Volume | Estimated sales lift attributed by an experiment or econometric model | SmashBrand |
Are products reaching the right channels?
| Metric | Description | Source |
|---|---|---|
| Net Sales Revenue (NSR) | Revenue after returns, allowances, and discounts | Industry standard (spirits & CPG) |
| Trade Spend Effectiveness | ROI on promotional and trade-focused investments | NielsenIQ |
| On-Trade vs Off-Trade | Sales split between on-premise (bars) and retail | Circana |
| eCommerce Share | % of total sales via online retail channels | Circana |
Store every view on one shared set of facts
Two views of the same brand and month should resolve to the same sales records. The proposed star schema keeps sales, market share, media spend, brand health and distribution in five fact tables, linked to shared dimensions. Their grains differ: a quarterly survey cannot become a daily observation just because the dashboard has a date filter.
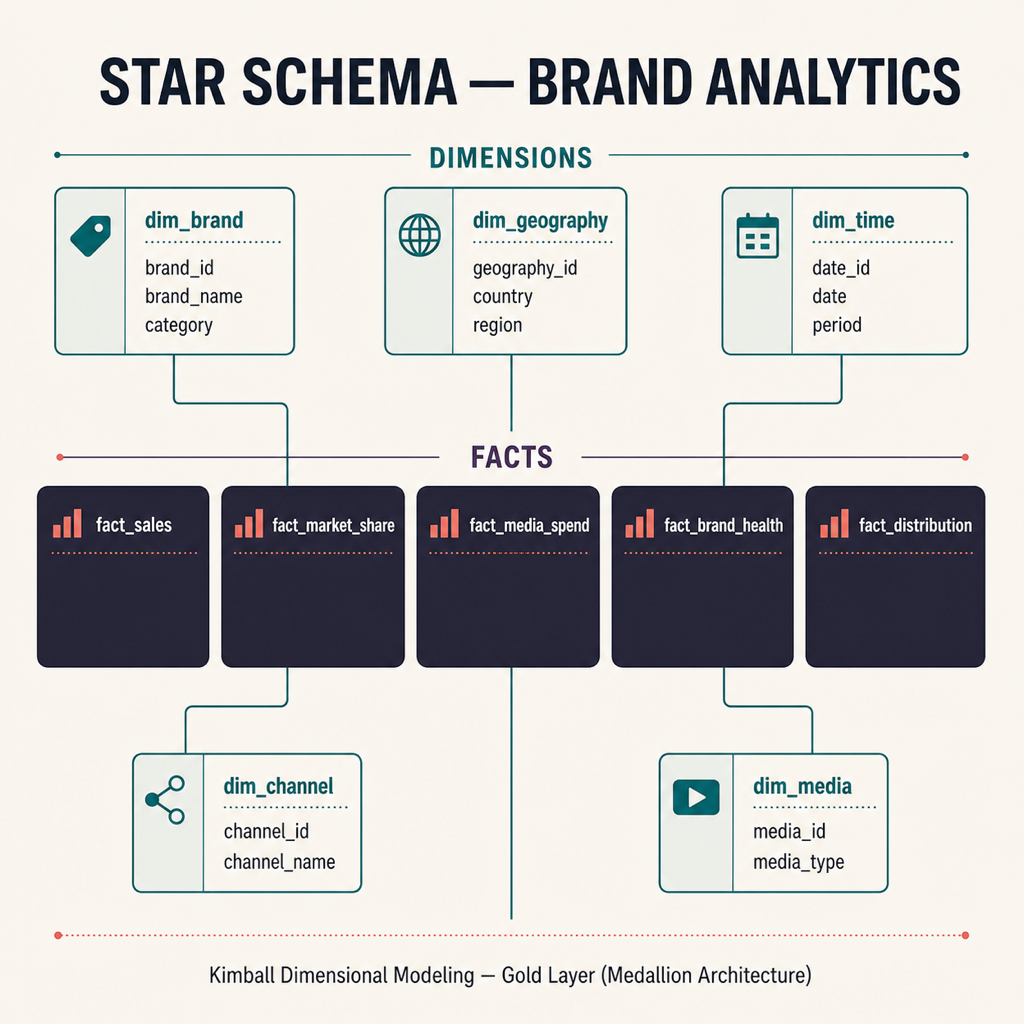
Shared definitions: brands, markets, dates, and channels
| Dimension | Key Attributes | SCD Type |
|---|---|---|
dim_brand | brand_name, sub_brand, category, segment, portfolio | Type 2 |
dim_geography | country, region, sub_region, city, channel | Type 1 |
dim_time | full_date, year, quarter, month, week, day_of_week | N/A |
dim_channel | channel_name, channel_type (On-Trade, Off-Trade, eComm) | Type 1 |
dim_media | media_channel, sub_channel, campaign_name, creative_name | Type 2 |
Measurable events: sales, distribution, media, and brand health
| Fact Table | Key Metrics | Granularity |
|---|---|---|
fact_market_share | volume_share, value_share | Brand x Geo x Month |
fact_sales | sell_in_volume, sell_out_volume, net_sales_revenue | Brand x Geo x Channel x Day |
fact_media_spend | spend_amount, impressions, clicks, GRPs | Brand x Geo x Media x Day |
fact_brand_health | awareness_pct, consideration_pct, trial_pct | Brand x Geo x Quarter |
fact_distribution | numeric_distribution, weighted_distribution, rate_of_sale | Brand x Geo x Month |
Separate raw evidence from cleaned and reportable data
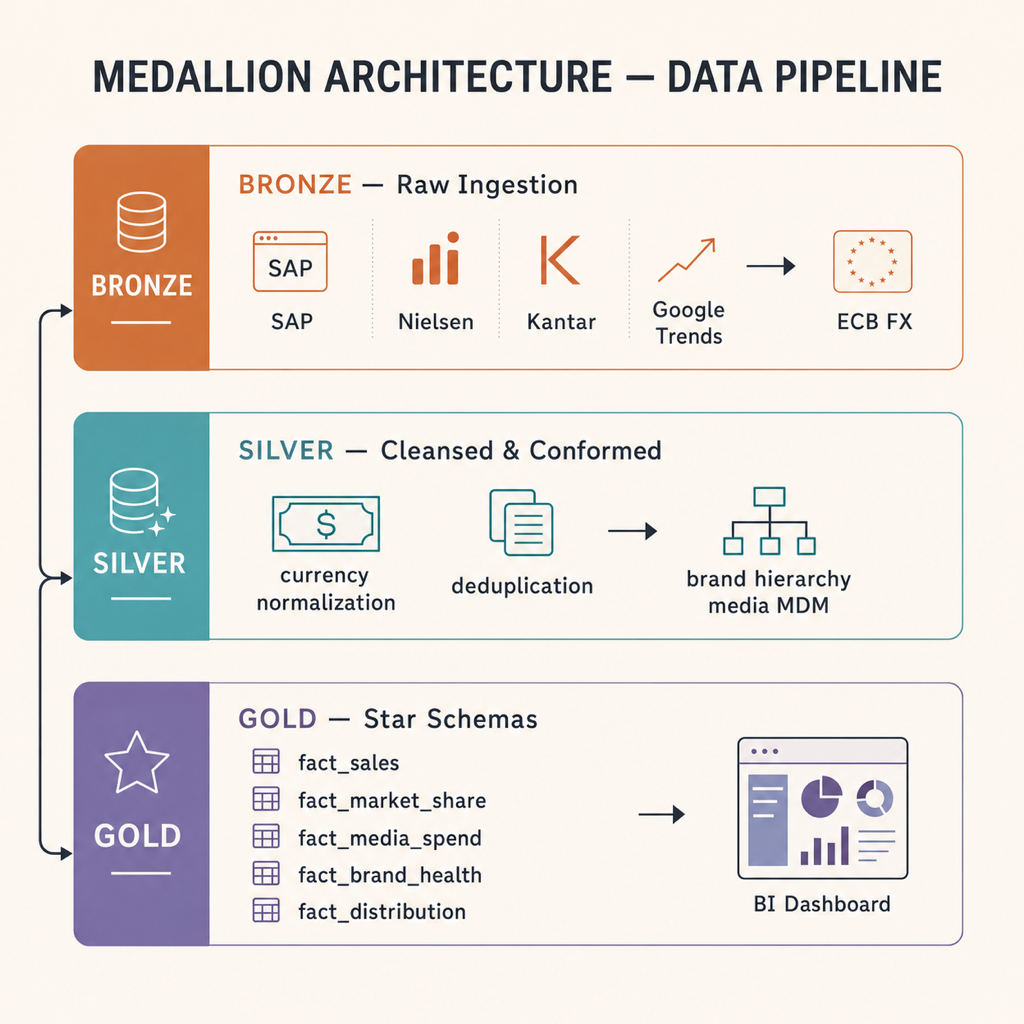
The pipeline separates three stages. Bronze retains source data as received. Silver applies currency rules, removes duplicates and maps names such as “Absolut” and “ABSOLUT VODKA” to a governed brand identifier. Gold publishes the shared facts and dimensions. Retaining the intermediate data gives an analyst somewhere to check whether a disputed value changed during ingestion, cleaning or aggregation.
Use public data to test the model, not to stand in for 73 markets
The datasets below offer different test cases: liquor purchases, shopping baskets, media spend and exchange rates. They can exercise parts of the model before company data is available. They do not form a matched global panel, and a chart built from them cannot validate the private company's market share or campaign impact. Access conditions and licences need checking with each publisher.
| Dataset | Use Case | Access |
|---|---|---|
| Iowa Liquor Sales | Licensed retailers’ liquor purchases; brand, category and geographic analysis | data.iowa.gov |
| dunnhumby: The Complete Journey | Household purchases for trial, repeat and loyalty analysis | Publisher or dataset mirror; check terms |
| Instacart Market Basket | Product associations within online grocery orders | Kaggle; check dataset licence |
| Advertising & Sales Dataset | Illustrative spend/sales relationships, not proof of incremental impact | Exact dataset and licence still to identify |
| Google Trends | Relative search interest, not a brand-awareness survey | Google Trends exports |
| World Bank Open Data | GDP, population, inflation and country context | World Bank data portal |
| ECB Exchange Rates | Currency conversion and constant-currency analysis | ECB data portal |
Change the view without changing the calculation
The executive view summarizes global performance. A brand director compares markets; a country manager needs product-level detail. These are separate views of shared calculations, not separate definitions of sales. The layouts below are design choices for those tasks, not measured usability results.
A one-page summary with at most six headline metrics in this design. Red, amber and green status flags need agreed thresholds.
Mix of financial, market share, and brand health metrics per brand. Structured comparison vs. prior period and vs. plan.
Small multiples put one chart per country in a grid. Matching axes and periods keep the comparisons interpretable.
Break down changes in NSR into volume, price and mix contributions. This explains the calculation; it does not establish what caused demand to change.
Use consistent visual conventions for actuals and budget across reports. The same bar style should not mean actuals in one market and plan in another.
Show the comparison period and highlight the relevant change. Keep any recommendation separate from the observation it rests on.
Centralize the rules without centralizing every delivery team
The scope covers 73 countries, more than 15 currencies and several source formats. The proposed split gives country teams responsibility for their data, with common contracts for brand identity, conversion rules, periods and publication checks. It depends on those teams having the capacity to support what they publish; assigning an owner on a diagram is not enough.
Test country filters and brand views on a small stack
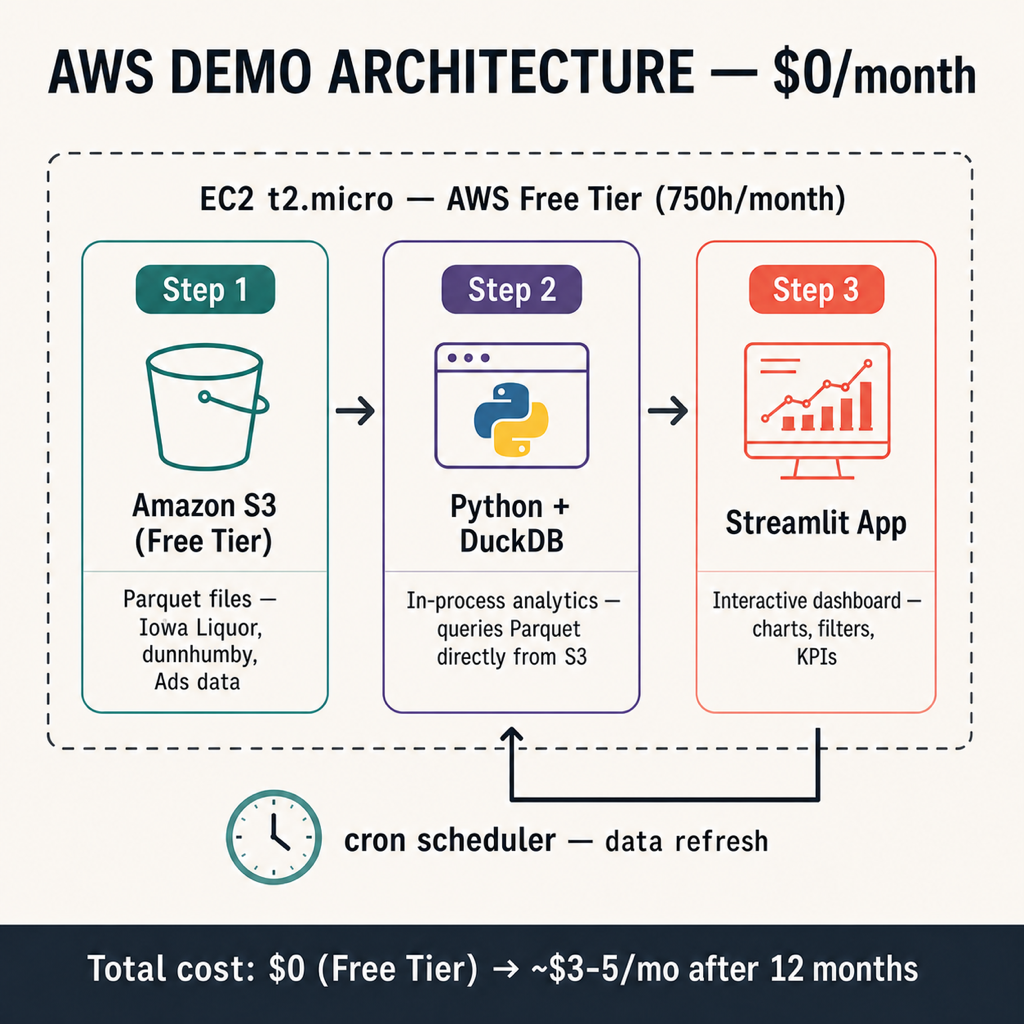
The 2024 prototype let a stakeholder filter by country and inspect a brand without first funding a production platform. The stack below was reported to fit within the free-tier allowances available then. This page does not include a billing record, a load test or evidence that the prototype ran the full 73-market workload.
| Component | Technology | 2024 cost basis |
|---|---|---|
| Data Storage | Amazon S3 (Parquet files) | Free Tier (5GB) |
| Processing & Analytics | Python + DuckDB, queries Parquet directly from S3 | $0 |
| Dashboard | Streamlit, interactive Python web app | $0 (self-hosted) |
| Orchestration | Linux cron job, periodic data refresh | $0 |
| Hosting | EC2 t2.micro | Free Tier (750h/mo) |
Options if the prototype’s requirements change
A candidate for SQL-and-Markdown reports when maintaining a Python dashboard is not part of the team’s remit.
A candidate for self-hosted BI when analysts need to explore data beyond the views defined in the prototype.
Revisit orchestration when dependencies, retries and backfills become hard to manage with cron. The number of steps alone is not a reason to switch.
Methods and source entry points
- NielsenIQ. Market Measurement. nielseniq.com
- Circana. Consumer Insights for the Alcohol Industry. circana.com
- Overproof. 15+ KPIs Alcohol Brands Should Track. (Oct 2024)
- Kantar. BrandZ Brand Valuation Methodology. kantar.com
- Kimball Group. Type 2: Add New Row. Type 2 dimension history
- Databricks. Medallion Lakehouse Architecture. Bronze, Silver and Gold layers
- Google Meridian. Media Mix Modeling. developers.google.com
- Meta Robyn. Open-Source MMM. facebookexperimental.github.io
- State of Iowa. Iowa Liquor Sales Open Dataset. data.iowa.gov
- AWS. EC2 Free Tier usage and eligibility. Account-date and usage conditions
- DuckDB. Parquet Import. duckdb.org
- Streamlit. Create an App. docs.streamlit.io